Run Time Results
Middleware-integrated Measurement, Detection, and Enforcement
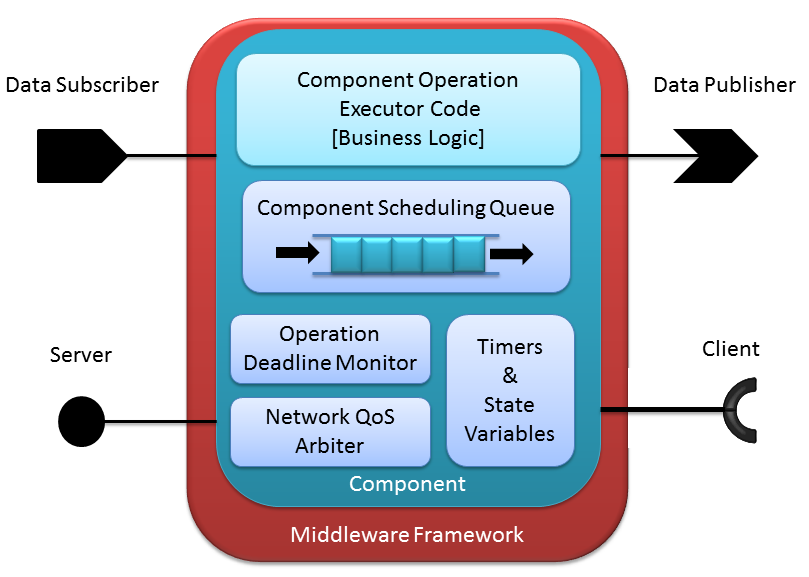
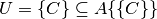
Figure 1: Schematic representation of a software component.
Our run-time research and development of measurement, detection, and enforcement code for networked applications is built on the foundation of component-based software engineering (CBSE). The goal of CBSE is to provide a reusable framework for the development of application building-blocks, called components so that developers can develop and analyze applications in a more robust and scalable manner. In CBSE, a component, shown schematically in Figure 1, is the smallest deployable part of an application and is defined as:

Where
 is the set of all timers within the component. A
timer provides a periodic event trigger to the component which
triggers the callback associated with
is the set of all timers within the component. A
timer provides a periodic event trigger to the component which
triggers the callback associated with  .
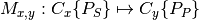
. is the set of all input/output ports within the
component. An i/o port provides a mechanism for message passing and
event triggering between components, and may take the form of
asynchronous publish/subscribe or synchronous client/server
interaction patterns. Similarly to timers, each incoming event
triggers the callback associated with
is the set of all input/output ports within the
component. An i/o port provides a mechanism for message passing and
event triggering between components, and may take the form of
asynchronous publish/subscribe or synchronous client/server
interaction patterns. Similarly to timers, each incoming event
triggers the callback associated with  .
. is the single thread which executes all event events for
the component, in FIFO order, without preemption.
is the single thread which executes all event events for
the component, in FIFO order, without preemption.
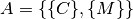
From this component definition, we can define an application as:
Where
 is the set of components in the application
 is the set of mappings between ports of the
components in , for instance connecting a subscriber of
is the set of mappings between ports of the
components in , for instance connecting a subscriber of
 to a publisher of
  ,
,  .
.
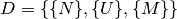
And finally, an application’s components are grouped into processes and distributed onto the nodes of a system through a deployment defined as:
Where
 is the set of hardware nodes in the system
 is the set of processes defining the deployment,
where a process is a collection of components
is the set of processes defining the deployment,
where a process is a collection of components
 .
.- is the set of mappings between processes and nodes
in the system, e.g.
 .
.
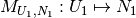
Note here that though the components may be single threaded internally, the application containing these components may run them in parallel, e.g. by grouping them into a process or distributing them among the hardware nodes of the system. An example application and deployment onto a system of nodes is shown in Figure 2. Note that multiple applications (shades of blue in this figure) may be deployed simultaneously onto the same system and may even interact with each other.
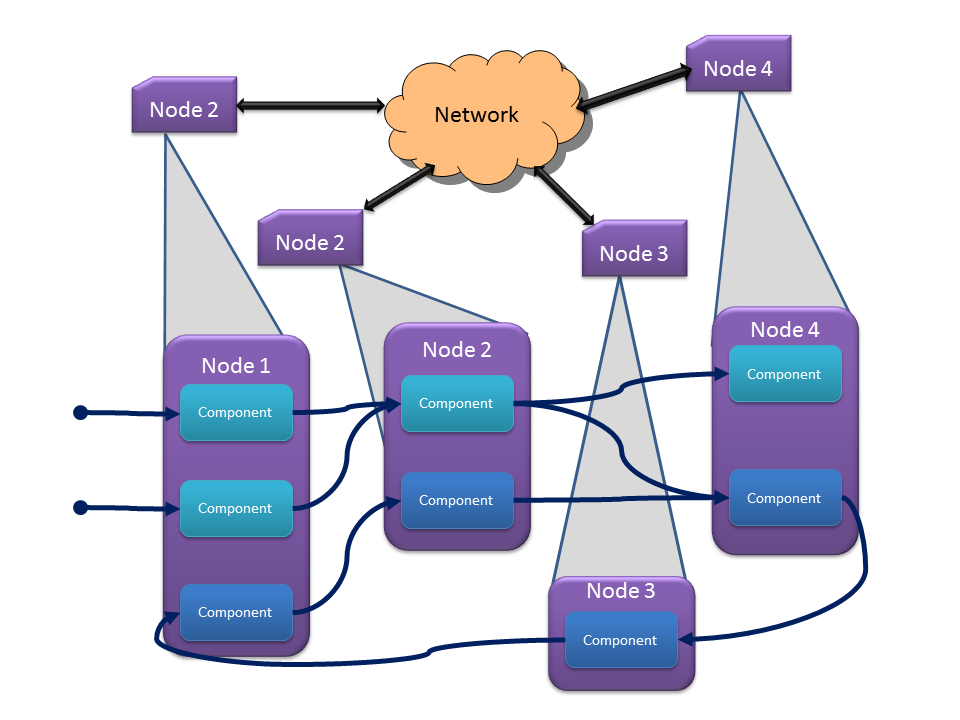
Figure 2: Two example distributed CBSE applications deployed on a system with 4 nodes.
We have implemented these features based on our design-time results:
- Traffic generators according to profile generated into sender code
- Receiver service according to profile generated into receiver code
- Measurement of output traffic on sender side and input traffic on server side generated into code
- Detection of anomalous sending on sender side
- Mitigation of anoumalous sending on sender side
- Detection of anomalous sending on receiver side
- Push back to sender middleware through out-of-band channel for anomaly detection on server side
Each of these functions uses the same profiles which enable design-time system and application analysis. This integration not only helps with running experiments and data collection but also helps to ensure model to system consistency.
Figure 3: The structure of component-based applications and how their network traffic traverses the middleware and the OS stack.
We have implemented profile-based traffic generators and traffic measurement into our code generators that we use with our model-driven design software. We developed this toolsuite to create distributed component-based software which uses ROS as the communications middleware. For publish/subscribe interactions between components, into the generated code we add generic traffic generators which read their associated profile from the deployment XML file and publish traffic on their publisher port according to that profile. Additionally, these publish operations are generated to use a small wrapper which can measure the publish rate and can decide to throw a profile exceeded exception if the application attempts to send too much data or if the receiver has pushed back to the sender informing it to stop. The sender-side middleware layer is shown in Figure 3.
This push back from the receiver occurs through the use of an out-of-band (OOB) channel using UDP multicast, which receivers use to inform specific senders that they are sending too much data to the receivers (and possibly overflowing the receiver buffers). This OOB channel provides a mechanism by which the secure middleware layer can protect the system from malicious or faulty applications.
Into the receiver code (for subscribers) we additionally generate a receive buffer and receiver thread which reads the receiver profile from the deployment XML file and pulls data from the buffer according to the profile. In this scenario, the receiver has a capacity with which it can handle incoming data, and it has a finite buffer so it must use the OOB channel and measurements on the incoming data stream to determine which senders to shut down to ensure its buffer does not overflow. When the buffer has had some time empty (so that it’s not in danger of running out of buffer space), the receiver can use the OOB channel to inform the halted senders that it is alright to send again.
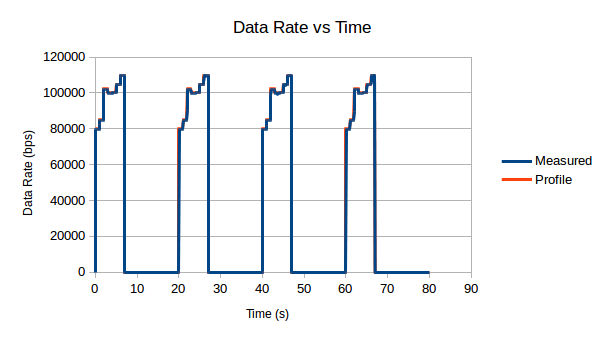
Figure 4: Demonstration of the accuracy with which our traffic generators follow the specified profile.
Note
The measured bandwidth profile is calculated based on
recorded time series data of ![[reception\_time,
message\_size]](_images/math/d402bd47034875456f3816c1116906b0efb5ddce.png) , so the bandwidth drops to nearly 0
periodically since the
, so the bandwidth drops to nearly 0
periodically since the  is so large between
the messages.
is so large between
the messages.
Note
Our original implementation of traffic generators performed better since they did not utilize a middleware layer and relied instead on simple point to point ipv6 connections. However, that code was less useful for system analysis because it could do nothing aside from traffic generation and measurement; our current implementation which generates traffic generation code into component code is more versatile for several reasons:
- The component-based code integrates directly into our development toolsuite and deployment framework so it can be easily deployed on our cluster.
- Configuring different system topologies or component to host mappings (deployments) is simpler and more robust, allowing us to perform more and more varied experiments.
- The traffic generation code can be removed (or the code can be regenerated without the option selected) and the rest of the component-based and middleware code is still useful as an actual application.
Distributed Denial of Service (DDoS) Detection
Denial-of-Service (DoS) [RFC4732] and Distributed DoS (DDoS) attacks can take many forms, but are generally classified as excessive traffic from a large amount of (possibly heterogeneous) sources targeted towards a single point or a single group. Such attacks are common to machines on the internet, but can also become a hazard for machines on private networks which become infected or inadvertently expose an input path for external malicious data.
These private or semi-private systems must have mechanisms for detecting and mitigating such attacks, and the combination of our design-time analysis and run-time measurement, detection, and mitigation tools provides a form for such capability. The goal of this work is for a receiver, which is being targeted for attack by a set of senders, to determine which of the senders are behaving anomalously and prevent them from sending any more data. In this way, a group of senders performing a DDoS attack can be mitigated by the targeted receiver. Towards this goal we make the following changes outlined below to our modeling/analysis framework and implementation.
If we relax the constraint from the design-time section that all sender profiles are absolute and the system behavior is completely known at design-time, then we not only expand the scope of applications that can be supported but also enable meaningful anomaly detection.
Whereas previously, profiles captured in their definition the
 as a function of time that the application
produced, we now alter the definition to capture two parameters:
as a function of time that the application
produced, we now alter the definition to capture two parameters:
 (
( ) and
) and  (
( ), which again are both functions of time. Just as
before, these functions are constant-valued between successive values
of
), which again are both functions of time. Just as
before, these functions are constant-valued between successive values
of  and are time-integrated to produce the
  and
and  cumulative profiles as functions of time. With
this specification, we no longer know exactly how much data an
application will produce at a given point in time, but instead are
provided two values by the developer: the
cumulative profiles as functions of time. With
this specification, we no longer know exactly how much data an
application will produce at a given point in time, but instead are
provided two values by the developer: the  and
and
 .
.
Now that we have these two profiles for the application, we could
simply analyze the data profile to determine buffer and
latency requirements, but this would end up wasting resources by
allocating memory and network resources of the system to the
application even if is not producing data at its max rate. Instead,
we analyze the system according to the data profile to
determine buffer requirements and latency for the application in the
system. In doing so, two buffer overflow risks are possible:
- Sender-side buffer overflow
- Receiver-side buffer overflow
We make the assumption that the application meters its sending to
prevent the first scenario, so that its data is not lost before making
it onto the network. In this case, the sender can still send data at
a rate greater than the , but that rate is partially
governed by the capacity given to it by the node’s network.
For the second case, we must ensure that there is no buffer overflow on the receiver-side. To enable this functionality, we must provide a mechanism for the receiver to communicate with the sender. This push-back communication should travel through a channel outside the communications channel that the application has access to, so that the application, either maliciously or inadvertently, cannot disrupt this push-back and in turn cause the receiver’s buffer to overflow. For this reason, we add into the sender and receiver middleware an out-of-band (OOB) channel that provides a communications layer between all senders and receivers that is invisible to the application. For our component model and communications middleware, we have implemented this OOB channel as a UDP multicast group.
Because the goal of this work is to only meter senders which are
producing too much data, we must define what too much data is.
Because we have developed these application profiles for analysis, and
these profiles describe the and of the
senders, they will be used to determine when a sender is sending too
much data. In this paradigm, a sender is determined as behaving
anomalously (i.e. sending too much data) if the sender,  is
sending data at a rate
is
sending data at a rate 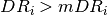 . The assumption implicit
in this comparison is that the sender, to be able to make this
comparison, has full knowledge of
. The assumption implicit
in this comparison is that the sender, to be able to make this
comparison, has full knowledge of  , since
  is
calculable on the receiver side. If the receiver’s buffer is filling
up, it looks through the all of the measured
is
calculable on the receiver side. If the receiver’s buffer is filling
up, it looks through the all of the measured  for each of
the senders it has been receiving data from, and compares it against
the sender’s . If the comparison is true, it uses the
OOB channel to push back to that specific sender, informing the
sender-side middleware to stop transmitting data until the receiver
has re-enabled that sender’s transmission. When the receiver has
emptied it’s buffer enough it can then use the OOB channel to
re-enable the disabled senders.
for each of
the senders it has been receiving data from, and compares it against
the sender’s . If the comparison is true, it uses the
OOB channel to push back to that specific sender, informing the
sender-side middleware to stop transmitting data until the receiver
has re-enabled that sender’s transmission. When the receiver has
emptied it’s buffer enough it can then use the OOB channel to
re-enable the disabled senders.
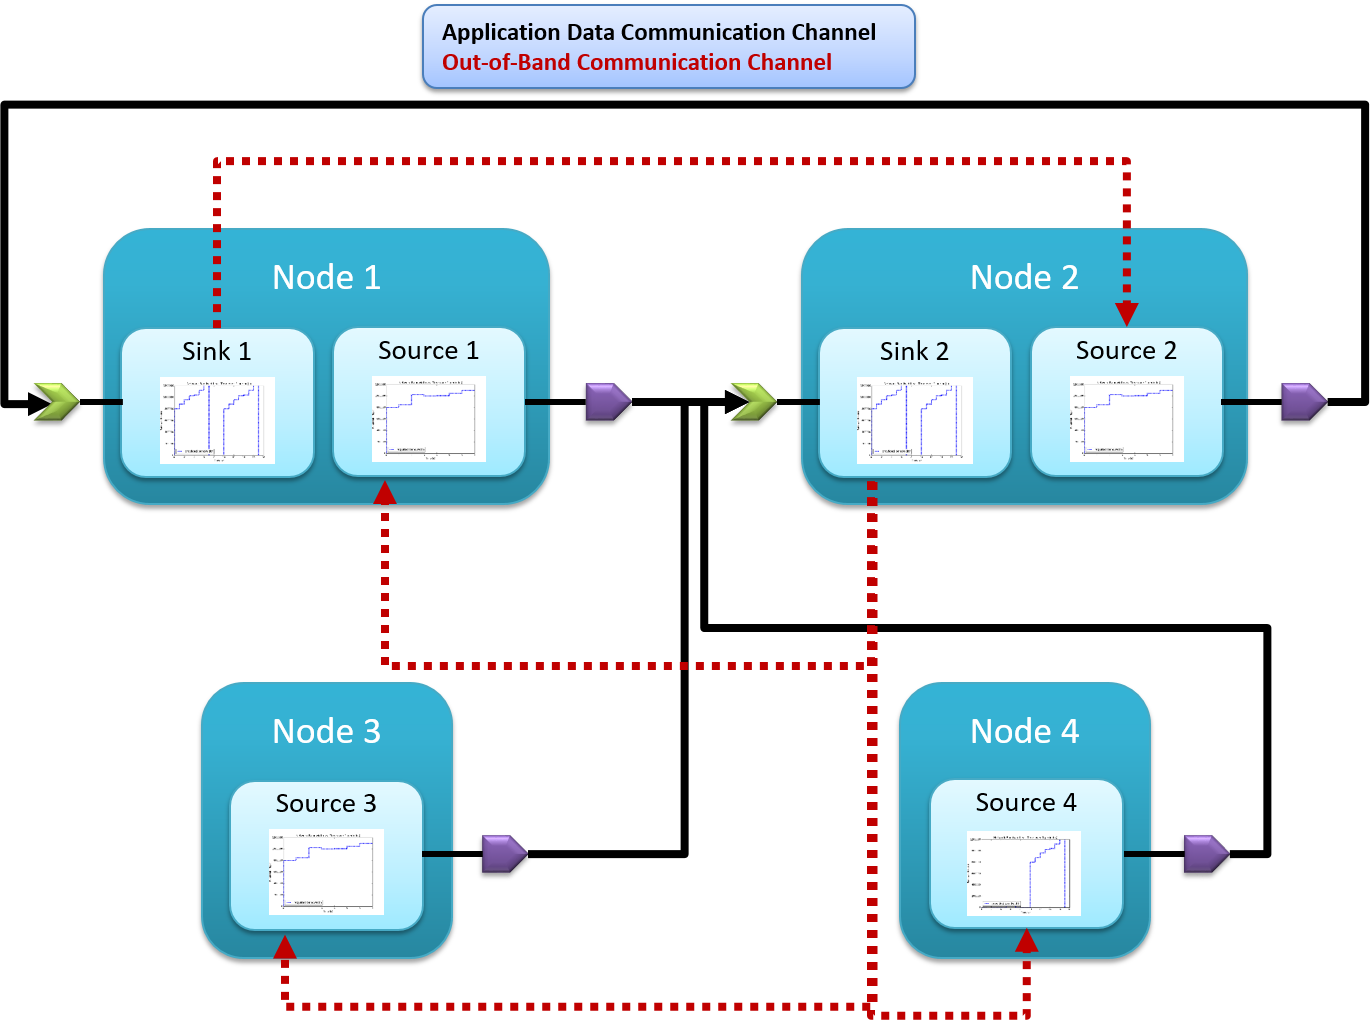
Figure 5: Nodes in an example network and how they communicate (using pub/sub).
We have implemented the OOB channel communication into our sender and receiver component code along with the profile measurement and comparison. Using these code generators, we are able to run experiments validating that the receiver can properly manage its buffer by throttling excessive senders during times of congestion.
We have shown experimentally (for the system in Figure 5) that, for example, a receiver side buffer size of 400000 bits, which would normally grow to 459424 bits because of excessive data pumps on the sender sides, is kept to 393792 by utilizing this out-of-band channel and secure middleware.
| [RFC4732] | M. Handley, et al., “Internet Denial of Service Considerations,” IETF, RFC 4732, Nov. 2006. [Online]. Available: https://tools.ietf.org/html/rfc4732 |